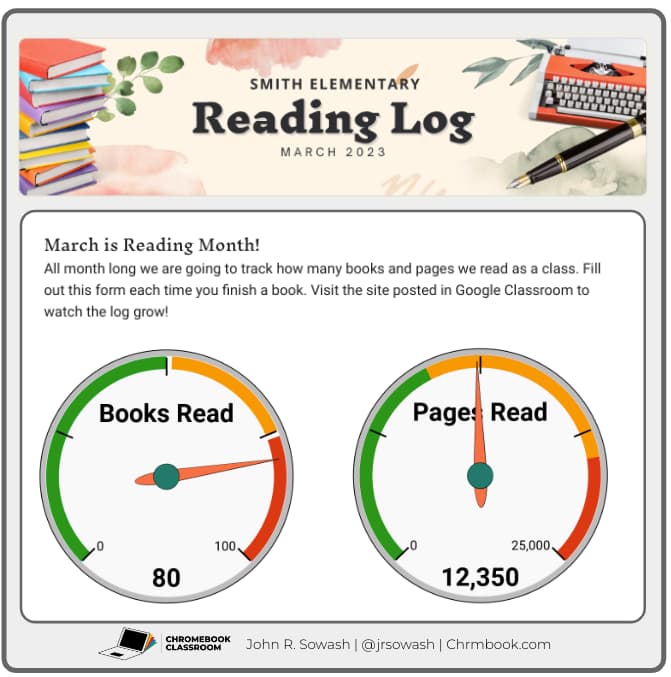
Setting a big reading goal for your school or class is a fun way to challenge students to be enthusiastic readers.
Many schools consider March to be reading month which is a great time to schedule a reading challenge.
Tracking the number of books and pages your students have read doesn’t have to be complicated or time-consuming. I recently did this for my school using Google Forms.
Set up your Google Form
First, you need to decide WHAT you are going to track:
- Number of books read
- Number of pages read
- Books by genre
- Books by student
Once you have this figured out, you can easily create a Google Form to track your progress.
I decided to track both the number of books AND pages. Students fill out our Google Form reading log form each time they finish a book and enter the length of the book.
You are welcome to make a copy of my Google Form reading log by clicking the button below.
Track your progress with a custom graph
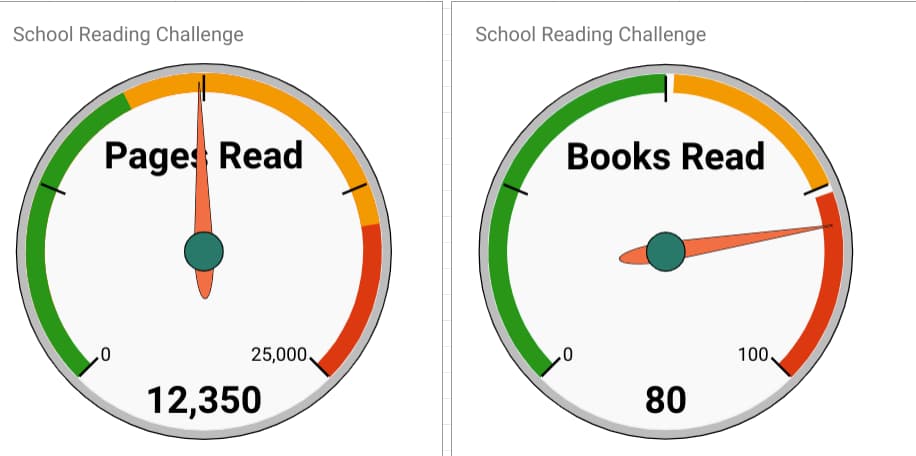
When a student submits the Google Form reading log, their data is sent to Google Sheets. Once we have the data in sheets, we can create a graph to visually track our reading goal progress…automatically!
While you could use a bar graph or a pie chart to track your reading goal, I like using the gauge chart. I think it’s cool and fits our reading challenge very well.
Related post: The best Chromebook resources for Elementary Students
The great thing about using the combination of Forms and Sheets is that these gauges will automatically update each time the form is submitted. You don’t have to do anything!
If you are familiar with the process of creating a chart with Google Sheets, you will be able to re-create my system pretty easily. If you would prefer a head start, click the button below to make a copy of my example.
Check your progress with Google Sites
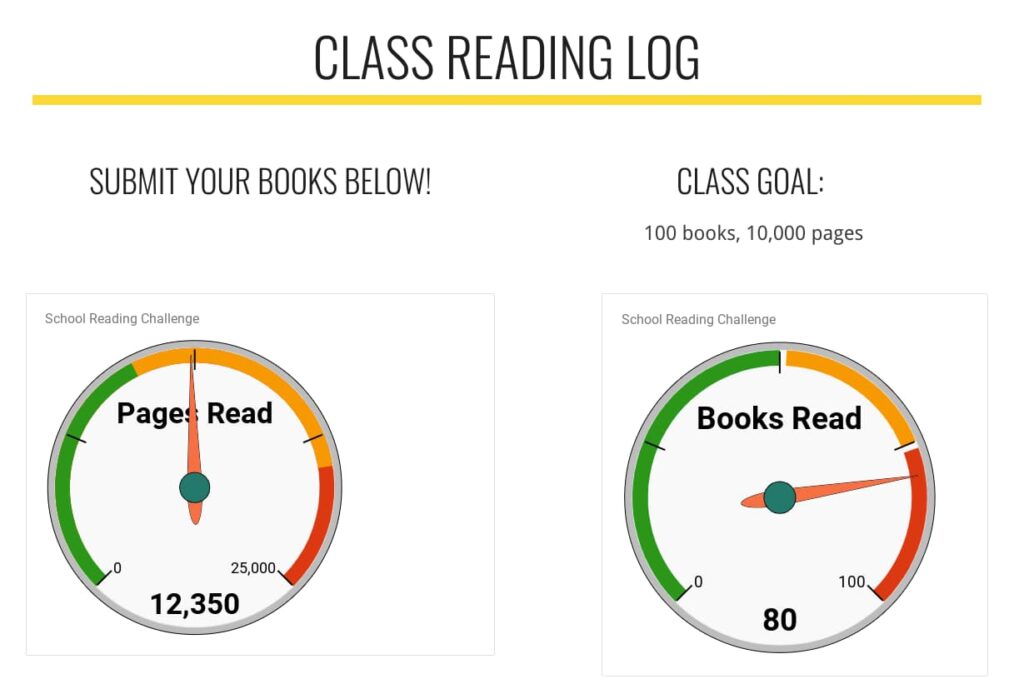
The whole point of this reading challenge is to get students excited about picking up a book! One way to do this is to give students access to view your reading log gauge. They will be so excited to watch the needle move up each time they submit the reading form.
You can insert your newly created graphs into a Document, Presentation, or Google Site and watch it grow!
Related post: Simple Elementary Journal or Portfolio
Personally, I like using Google Sites; it’s easy to do and I can also embed my Google Form reading log right next to it.





Love this idea! Thank you for sharing so many resources. I’m sure this took a long time to build. I do have a question. When I copied the form and the sheet, I attached the sheet to the form to record responses. It the sheet, it made a new tab, Form Responses 2. I filled out the form and the info went to that tab, not the tab with the formula to create the charts. How can I make responses go to that tab that already has your formula in it? I copied and pasted and that worked but I don’t want to do that each time. Do I need the add on that you used?
Hi Alex,
Right, when you created a new form, it added a new sheet for the responses. You will need to re-create my formulas and chart on the new sheet.
Where do I find the formulas
Our school is using this awesome gauge to keep track of our reading goals. Thank you so much for creating this cool spreadsheet chart and sharing it!!
That’s great to hear! Happy reading!
Hi John I really love this idea and have tried really hard to get it to work but I can’t seem to work out your formula, Sheets is not my forte 😩 would you be able to share it?
Hi Veronica!
No problem…you can make a copy of my spreadsheet (click the button above) which will include the formulas that I used for the reading log.