Chromebook Lesson Ideas
Plotting Earthquake Data Using Google Draw
About the Project
This inquiry-based activity introduces students to concepts of plate tectonics and boundaries. By plotting earthquake data on Google Draw, students discover the location of plate boundaries. They will also gain experience reading and working with complex sets of data.
Lesson Overview
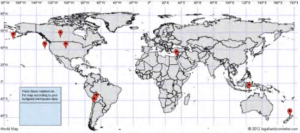
Create a Google Drawing that contains a world map with lines of latitude and longitude. The more lines of latitude and longitude, the better.
Go to the USGS earthquake data website and select earthquake data over a period of time. You may want to limit the magnitude range of earthquakes from 3.0-10.0. Download the CSV file for the earthquake data and print it out. Cut data into a manageable amount of events for each student (10 earthquakes per student works well) and distribute the sheets. Have students find the longitude and latitude for each event, then plot that earthquake data on the map in Google Draw.
An optional extension would be to have students share or print their finished maps and compare them with those of their classmates, then try to identify the fault lines where earthquakes occur most frequently.
Tips and Suggestions
Students will need to be familiar with latitude and longitude lines and how to plot a point when given this information. Providing students with a printed copy of their earthquake data keeps them from having to switch between their map program and the data set. Google Classroom is helpful in distributing the drawing template to students.
Lesson submitted by Meredith Nickerson, Dexter Schools, Michigan and Justin Ellsworth, Farmington Schools, Michigan


Hi John how can we buy this book The Chromebook classroom
It is available in print and digital form on Amazon: Chrmbook.com/book