How you can teach the Scientific Method using M&Ms
About the Project
Teaching the steps of the scientific method is a standard objects in elementary and high school science classrooms. This simple activity teaches the steps in the scientific method in a fun and simple way powered by Google Sheets.
This activity can be adjusted for elementary students all the way up through high school. Extend the lesson by asking older students to perform statistical analysis of the collected data.
Lesson Overview
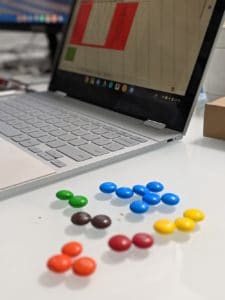
This lab requires small bags of M&Ms. You can give a bag to each student or to each lab group. Mini bags work best and can typically be found at Walmart and CVS.
- Ask a question – “Can you predict the color of the M&Ms in your bag?”
- Form a hypothesis – have students predict how many of each color M&M are in their bag. Have them record their prediction in the “prediction” tab of the Google sheet template. You can have students make individual predictions or predictions as a group.
- Perform an experiment – your experiment is pretty simple – open up your bag and seperate your M&Ms by color!
- Record your Data – have students enter the ACTUAL number of M&Ms by color into the “data” tab in the Google sheet template.
- Analyze and revise hypothesis – as a class, view the # in bag and # by color charts in the Google sheet template. How did your predictions compare with the data collected? What observations can you make about the distributions of color in a bag of M&Ms? Is the distribution even?
- Extend – for older students, you may ask them to perform a statistical analysis of the distribution of color. You can also compare the class results to the published factory color mix provided by the Mars candy company.
Tips and Suggestions
Plain milk chocolate M&Ms work best for this lab. You can use peanut M&Ms, but be aware of allergies! You could also extend this lab by comparing the color mix in various M&M flavors (Peanut vs. almond vs. plain vs. peanut butter)
When students are forming their hypothesis, make sure they don’t open up their bag of M&Ms! They can feel, smell, and shake the closed bag, but can’t open it!
Make sure that students add their data to the correct tab on the Google sheet. It is important to keep the hypothesis AND the actual data from each group so that you can compare them together.
In the provided spreadsheet graphs have already been created to display the total distribution of color across the entire class and the total number of M&Ms in each bag. For older students, you may wish to give them a copy of the lab data and have them create the graphs.


Reader Interactions